Project examples
Areas that already
gained clarity with
dashboards and KPIs
A few examples of what we usually organize in each area, always adapted to your business reality and questions.
Sales
- ✓Revenue and billing
- ✓Funnel conversion rates
- ✓Sales team performance
- ✓Average ticket and quota attainment
Finance
- ✓Cash flow
- ✓Income and expenses
- ✓Margins and profitability
- ✓Delinquency and financial forecasts
Marketing
- ✓Lead generation
- ✓CAC and campaign ROI
- ✓Performance by acquisition channel
- ✓Conversion along the customer journey
HR
- ✓Turnover and retention
- ✓Average time to hire
- ✓Absenteeism indicators
- ✓Training and development tracking
Logistics
- ✓Service level and on-time delivery
- ✓Average time between stages
- ✓Operational bottleneck detection
- ✓Logistics costs and productivity
Operations
- ✓Team productivity
- ✓Average execution times
- ✓Goal tracking
- ✓Spotting deviations and improvement opportunities
Gallery
Dashboards in practice
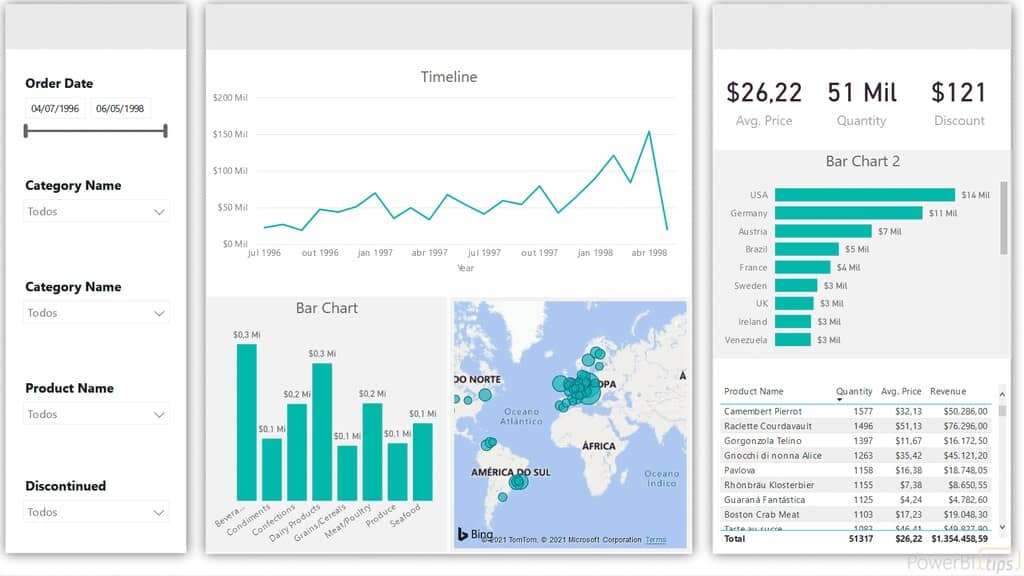
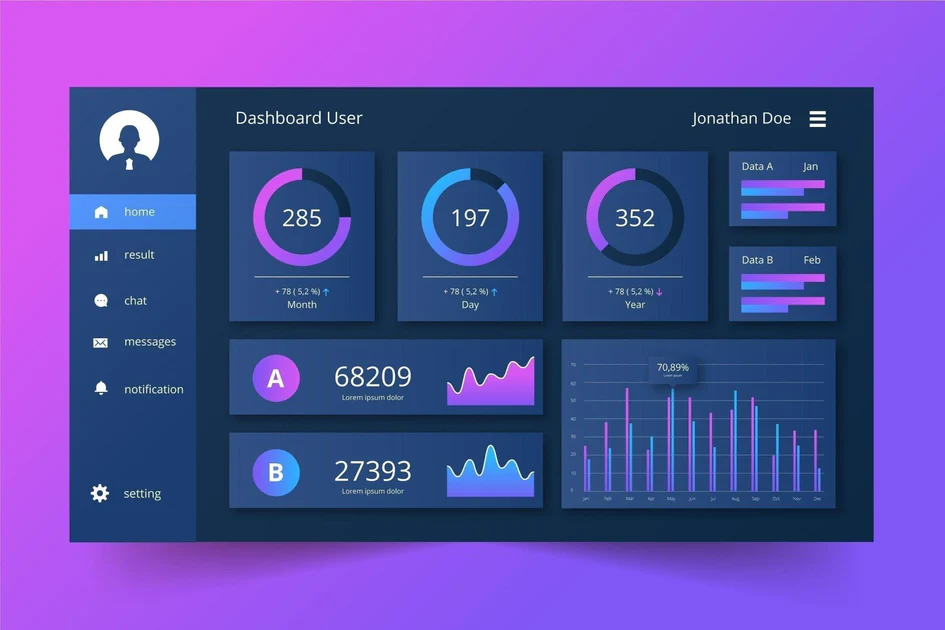
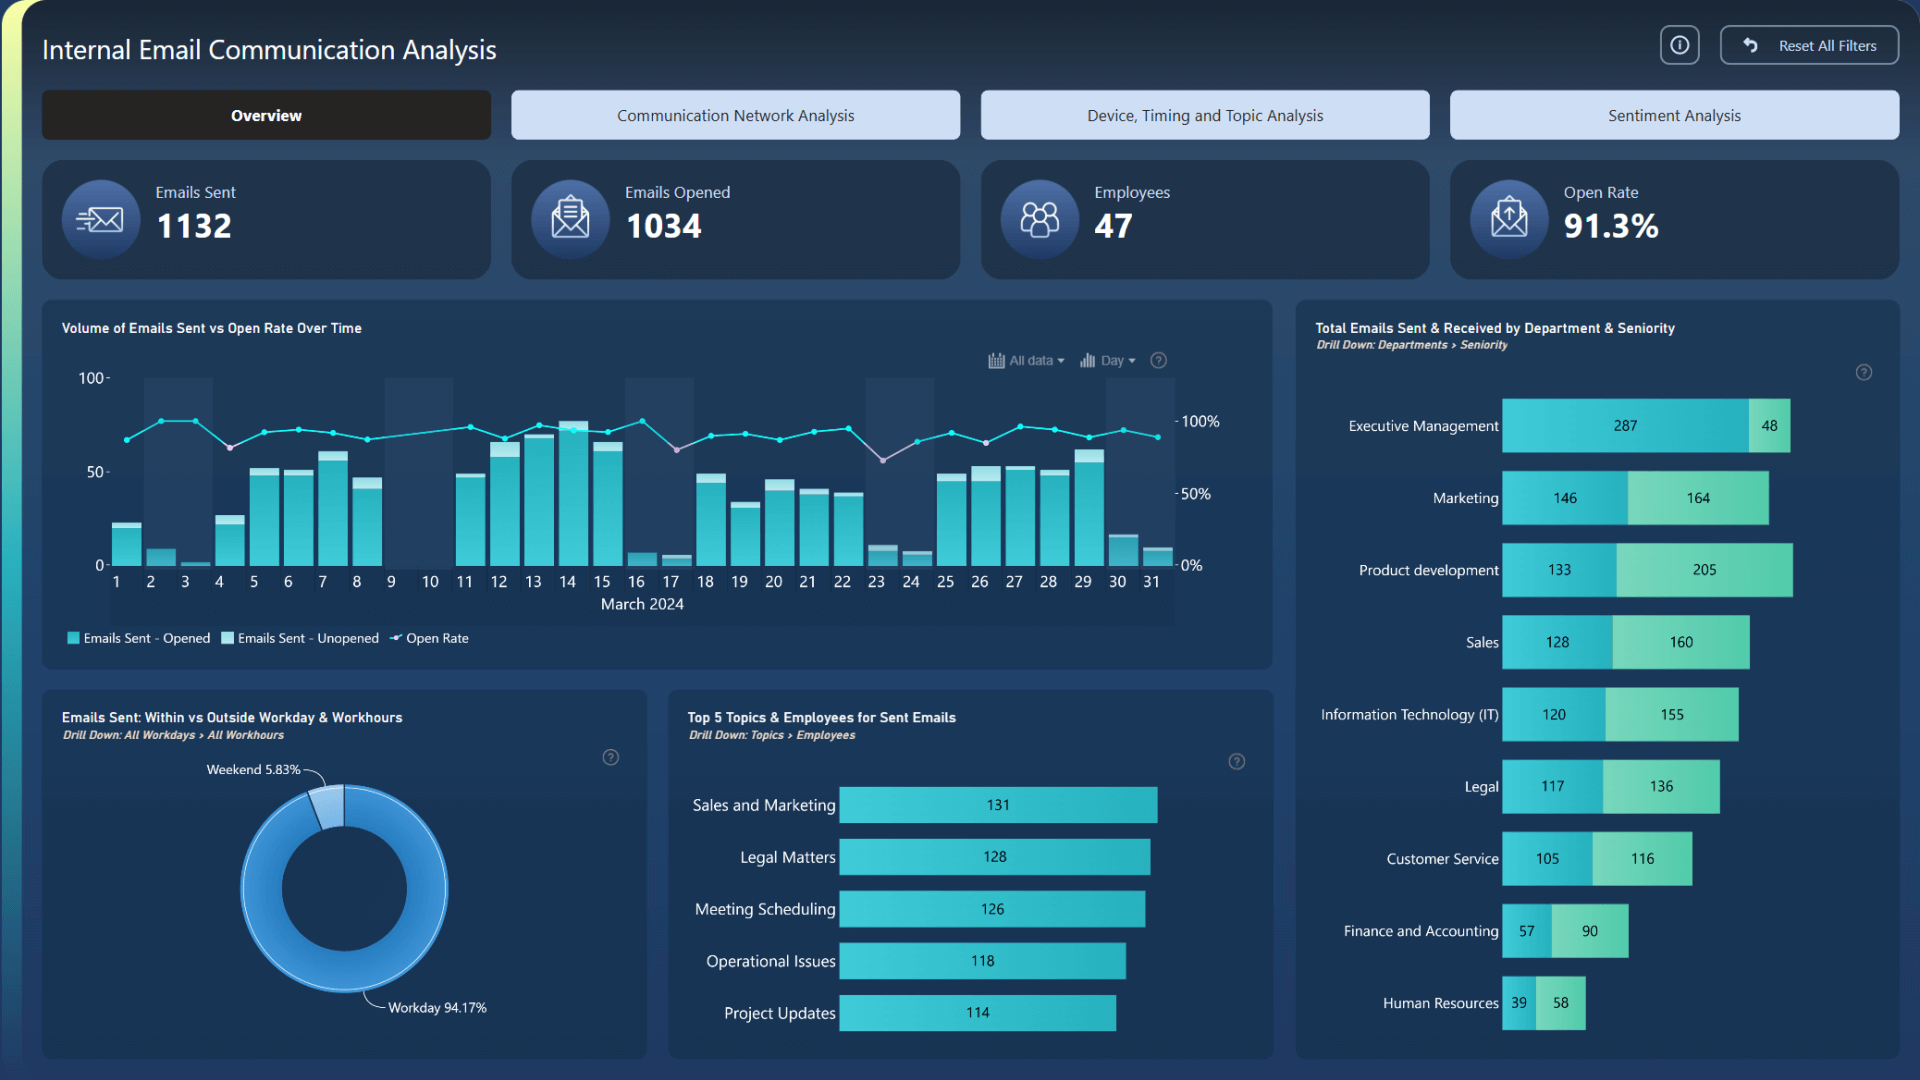


“When every number comes from one trusted source, meetings stop being debates about which spreadsheet is right, and become conversations about what to do.”
Loyal Consulting · Business IntelligenceDidn't find your area? It certainly works too
Any process that relies on spreadsheets and manual reports today can be automated.