

The transformation
We turn scattered data into a single reliable source for decision-making
Today at your company
- ×Spreadsheets scattered across email and WhatsApp
- ×Reports built manually every week
- ×Each team with its own version of the numbers
- ×Copy-pasting to build presentations
- ×Meetings arguing about which version is right
After Loyal
- Data centralized in a single source
- Automatic updates, no manual rework
- Standardized KPIs across every team
- Real-time dashboards
- Meetings focused on decisions
Through: Data Integration · Automation · Business Intelligence
Where do you start?
Choose the right entry point for where you are right now
Strategic conversation
Free Discovery Call
30 minutes to map your data bottlenecks, understand what's blocking decisions, and walk away with a concrete initial plan. No sales pitch. No commitment.
Best for · teams that don't know where to start
Schedule DiscoverySelf-assessment
BI Economics Calculator
Find out how much your team spends each year on manual data work. Takes under 3 minutes and generates an executive PDF ready to present to leadership.
Best for · teams that need to justify a data investment
Calculate now (free) →Before and after
From a spreadsheet marathon to a single screen
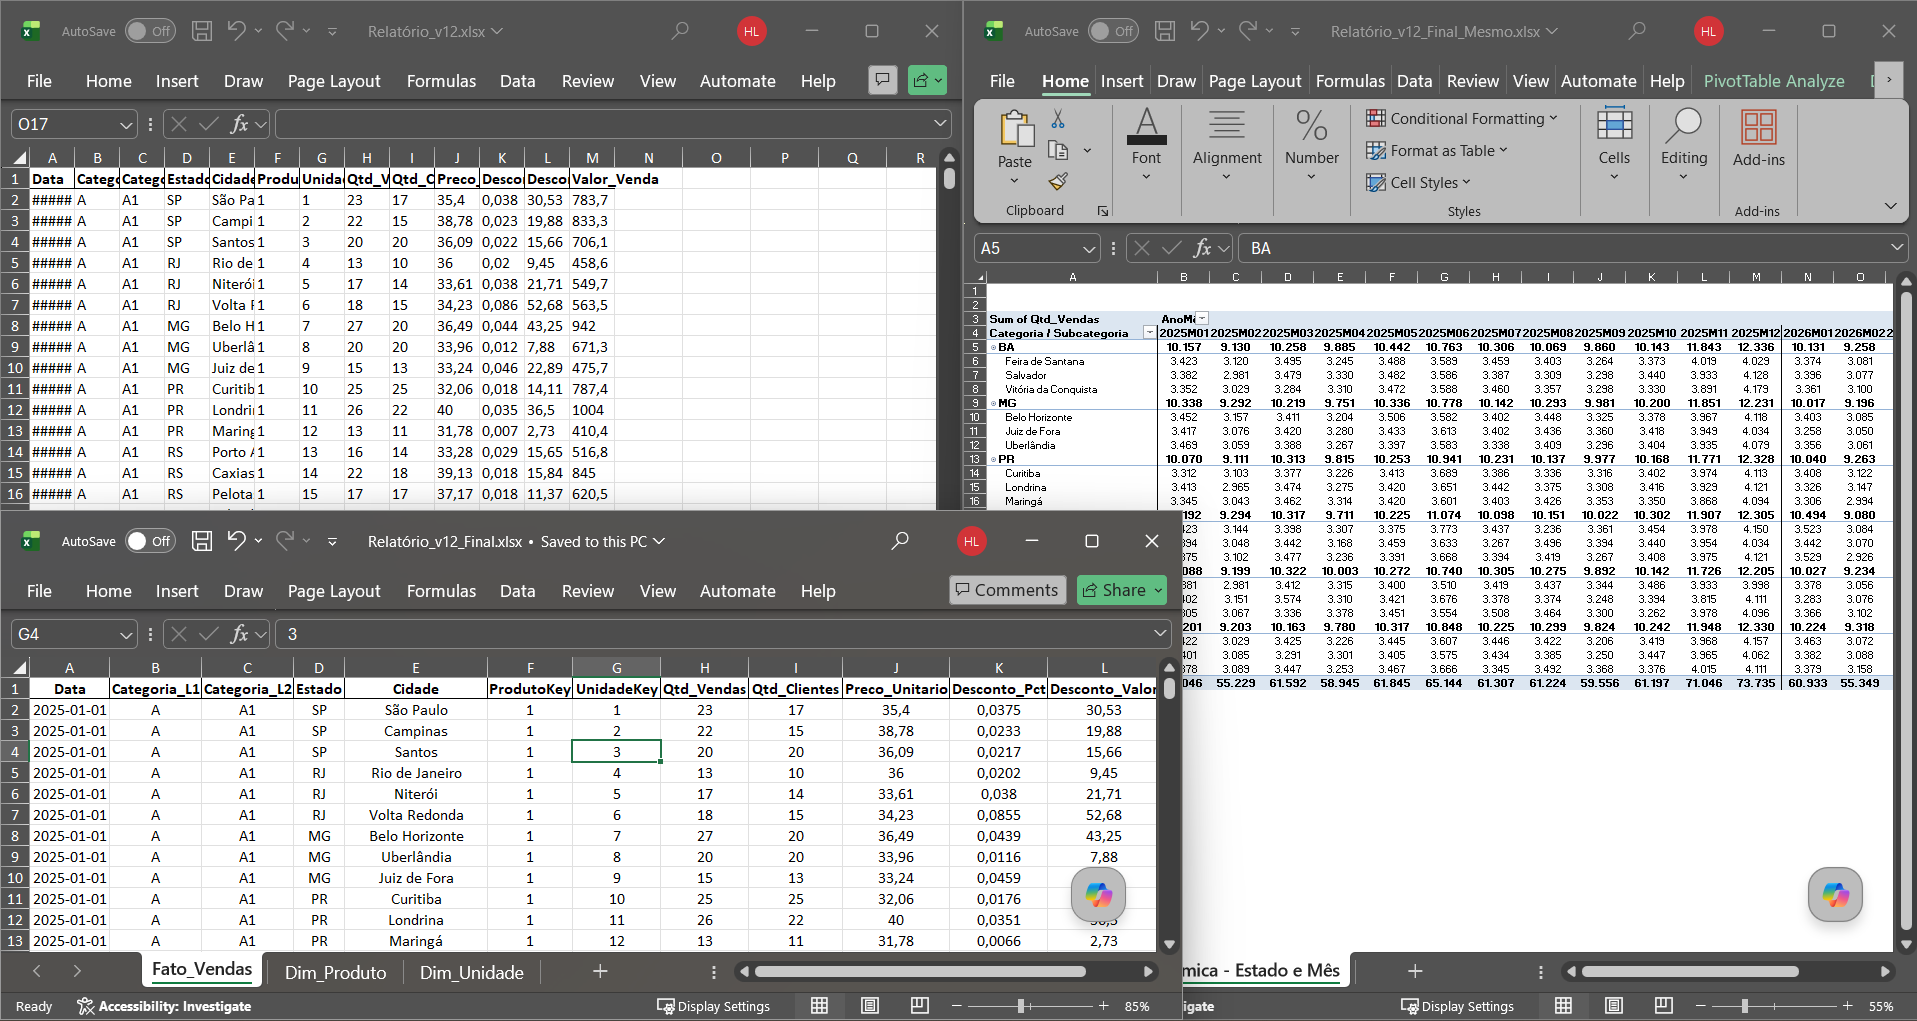
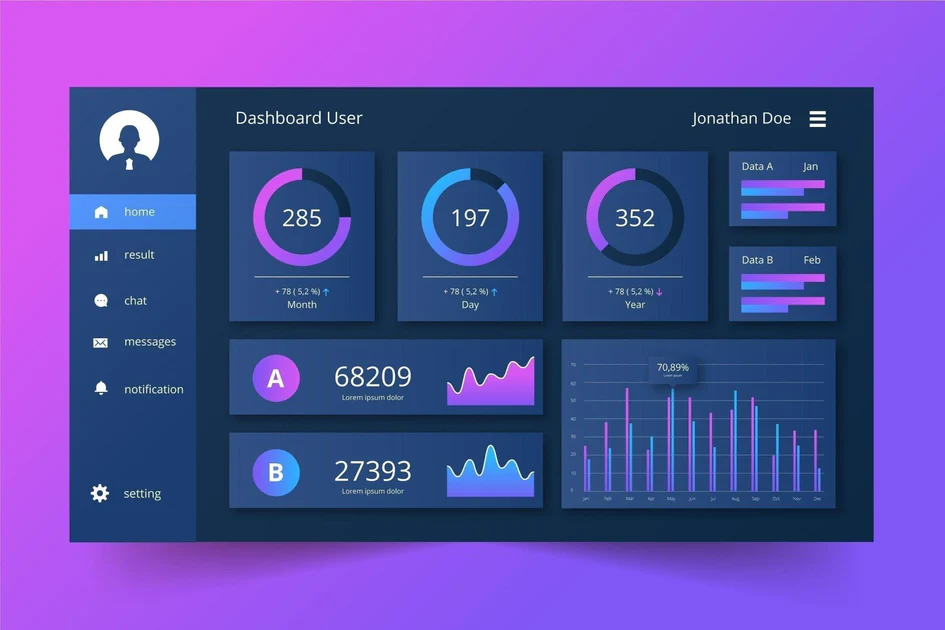
HOW IT WORKS IN PRACTICE
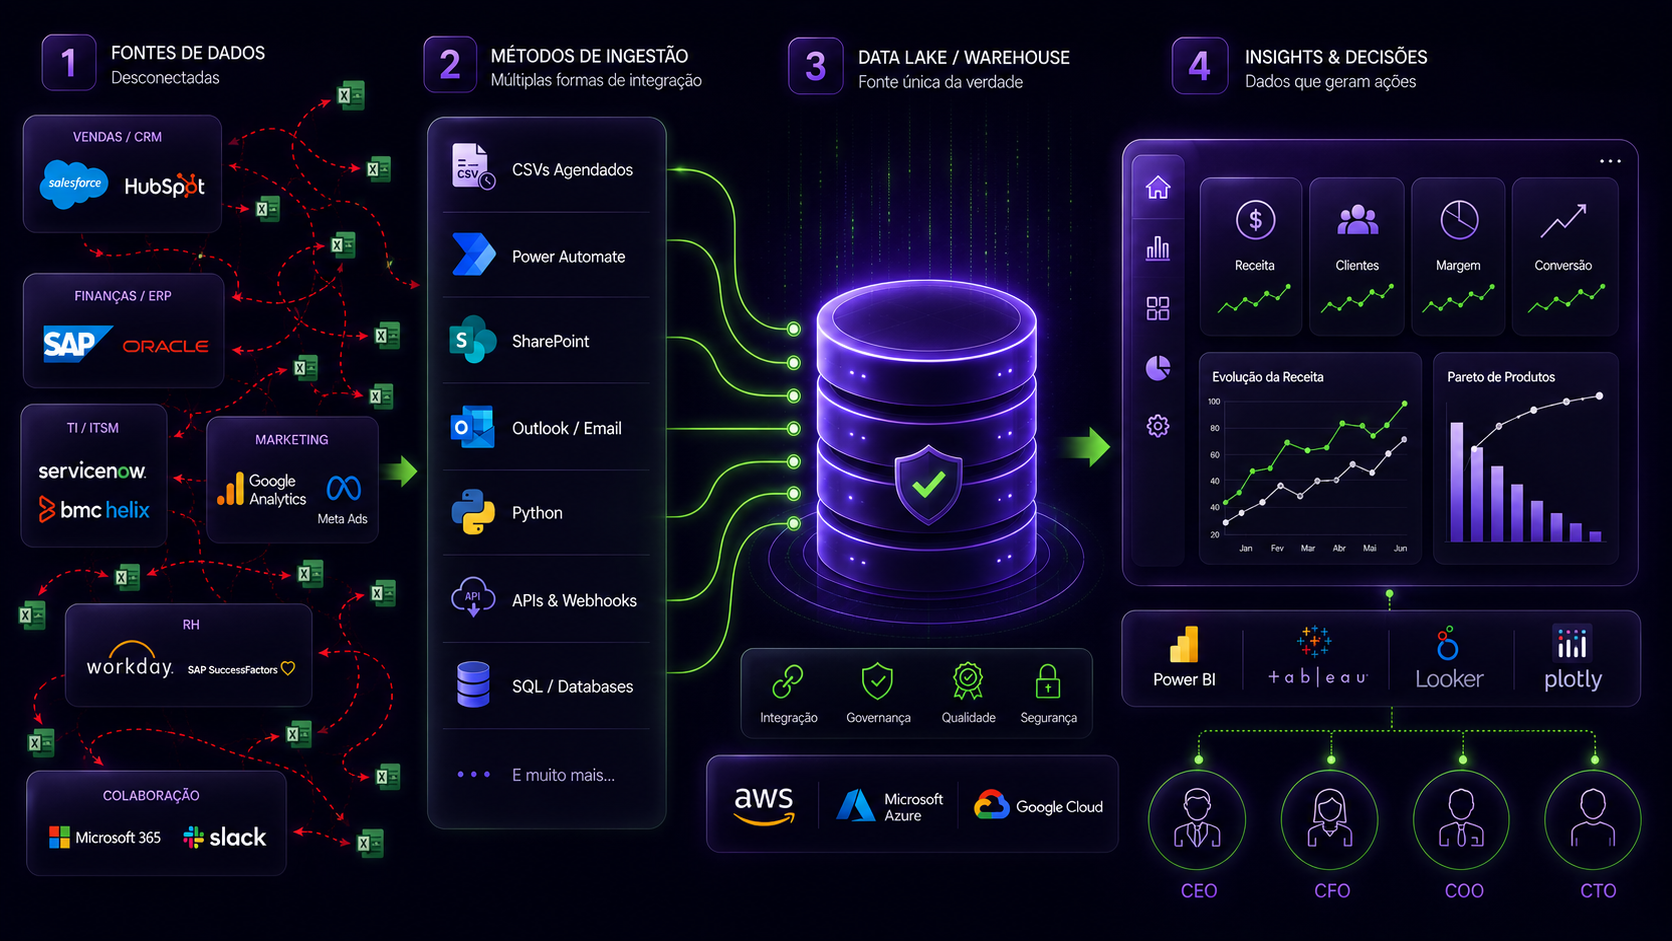
How it works
From assessment to dashboard in 5 steps
Assessment
We map your data sources, current indicators and bottlenecks to understand the real starting point.
Data integration
We connect spreadsheets, ERPs, CRMs and APIs into a single reliable model, accessible across all teams.
Automation
We eliminate manual rework by replacing repetitive processes with automatic update flows.
Dashboards
We build panels with the indicators that actually matter for your management: clear, direct and easy to use.
Ongoing support
Continuous support for adjustments, team training and indicator expansion as the business grows.
Problems we solve
These situations are preventing your company from growing with clarity
If you said yes to any of these, the problem is probably not in the reports. It is in how the data is organized.
- The numbers don't match across teams
- Every department has its own spreadsheet
- Reports always arrive too late
- You don't fully trust the indicators
- Your team loses hours consolidating data
- You don't know for certain which number is right
Research confirms the problem
It is not just your company
McKinsey Global Institute
“47% of global executives say data and analytics have significantly or fundamentally changed competition in their industries, while laggards face growing disadvantage.”
The Age of Analytics: Competing in a Data-Driven World · McKinsey Global InstituteDeloitte Insights
“Companies that become insight-driven speed up decision-making, reduce operational errors and build a sustainable competitive advantage over peers that still depend on manual data preparation.”
Insight-Driven Organisations · Deloitte InsightsPwC
“ERP data modernization unlocks value trapped in fragmented systems, turning disconnected data into a strategic asset for forecasting, reporting and confident decision-making.”
ERP Data Modernization · PwC“If each team has a different number for the same KPI, you don't have data. You have opinions.”
Loyal Consulting · Business IntelligenceAbout Loyal
Specialists in turning data into decisions
Loyal Consulting helps companies eliminate manual controls, integrate information and build reliable indicators for management.
Our focus is not just building dashboards. It is building the structure that makes the numbers meaningful and gets them there in time to influence the right decisions. We work alongside directors, managers, coordinators and supervisors, with lean projects and practical deliveries.
Find out where your company is losing time on data.
Calculate the real cost in 3 minutes — or schedule a free assessment with our team.
Free calculator · Executive PDF included · Or 30 min assessment, no commitment