Free assessment · 30 minutes
Tired of pushing for
data-driven decisions
while your team still
lives on spreadsheets?
Your team should be analyzing data, not preparing data. We automate reports, integrate data and build dashboards so your team stops losing time hunting for numbers.
No commitment. Initial assessment in under 30 minutes. You leave with clarity on bottlenecks, priority indicators and a first plan to reduce spreadsheet dependency and speed up decisions.
Free assessment · Or calculate your cost in 3 min







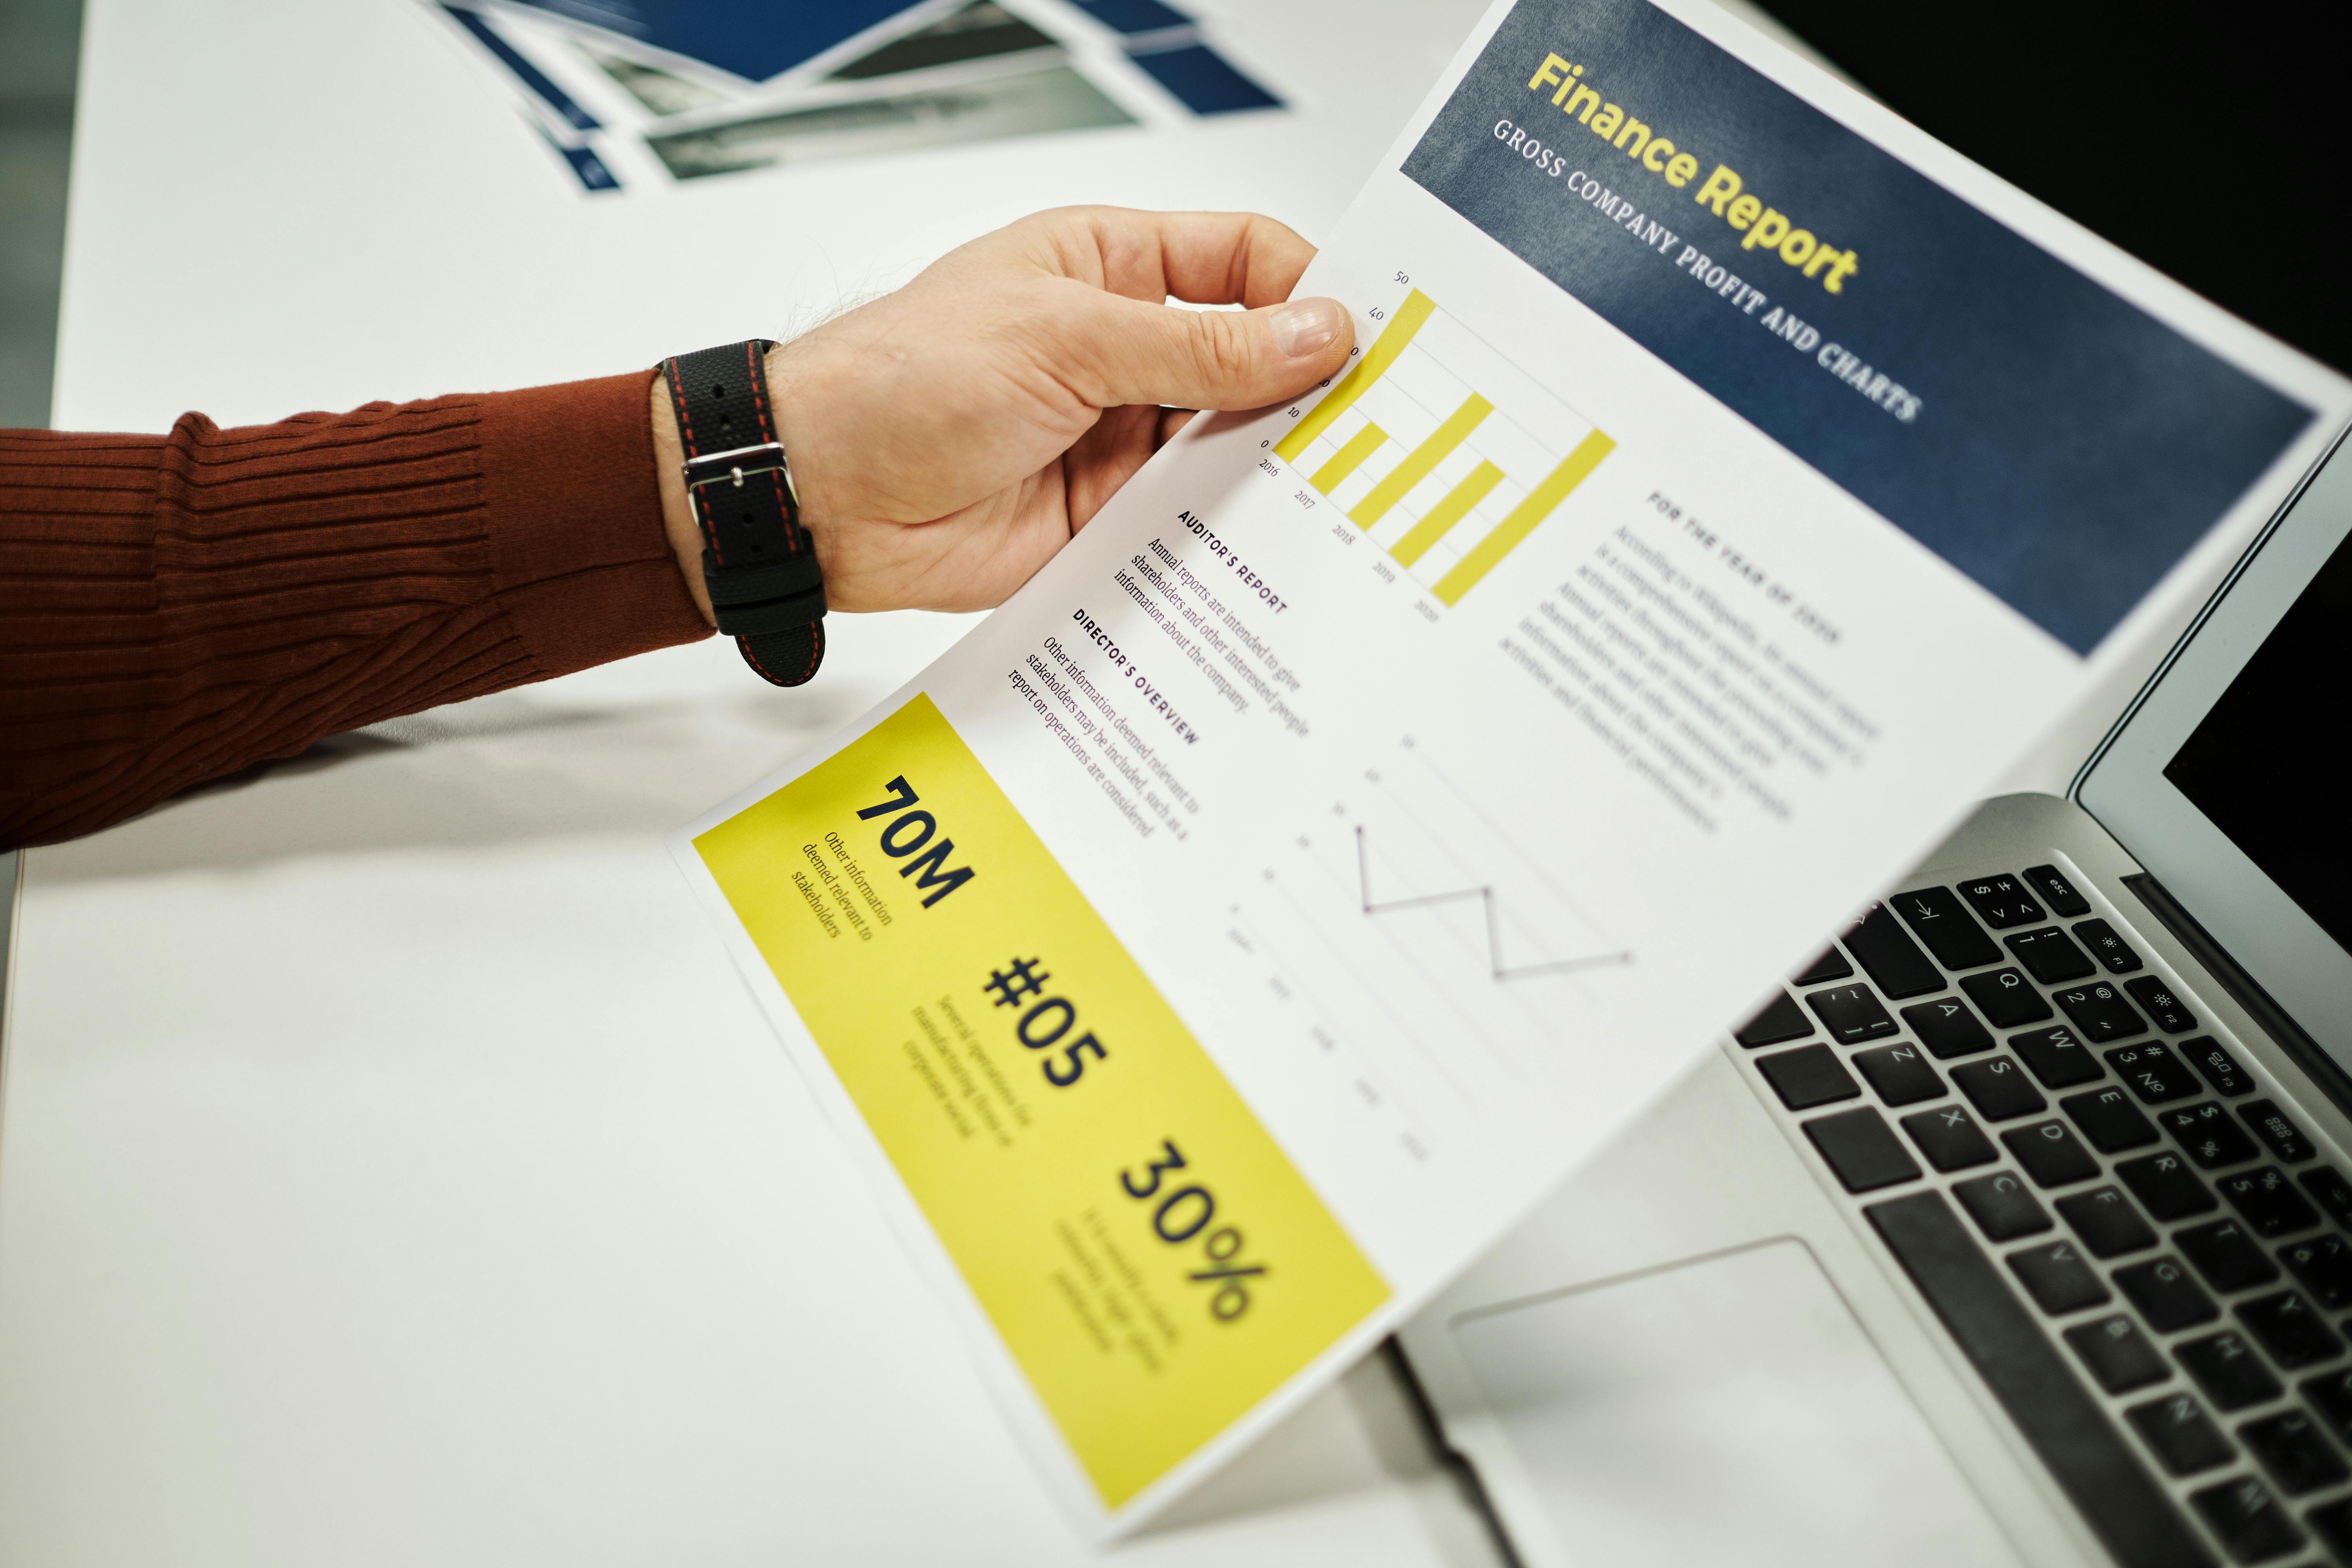

The transformation
Stop wasting time building reports. See what changes.
Today at your company
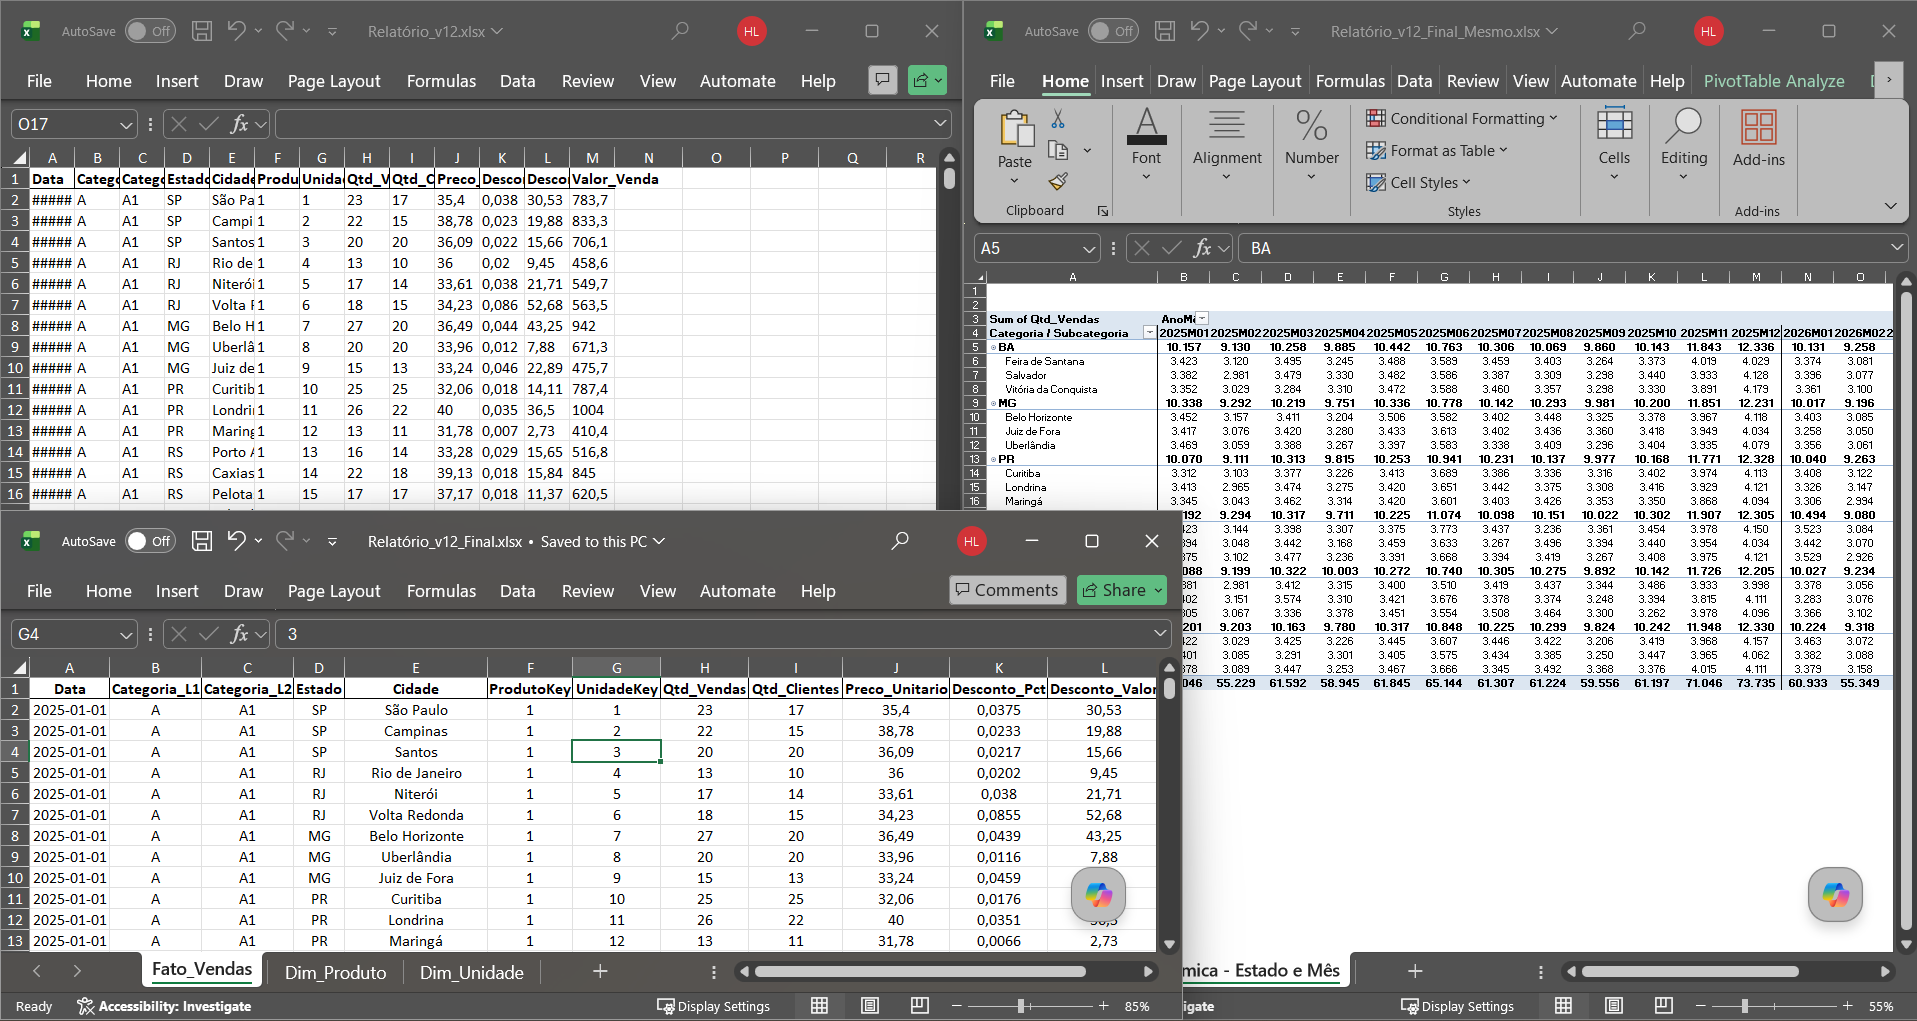
- ×Spreadsheets scattered across email and WhatsApp
- ×Reports built manually every week
- ×Copy-pasting to build presentations
- ×Meetings arguing about which number is right
- ×Inconsistent data across teams
After implementation
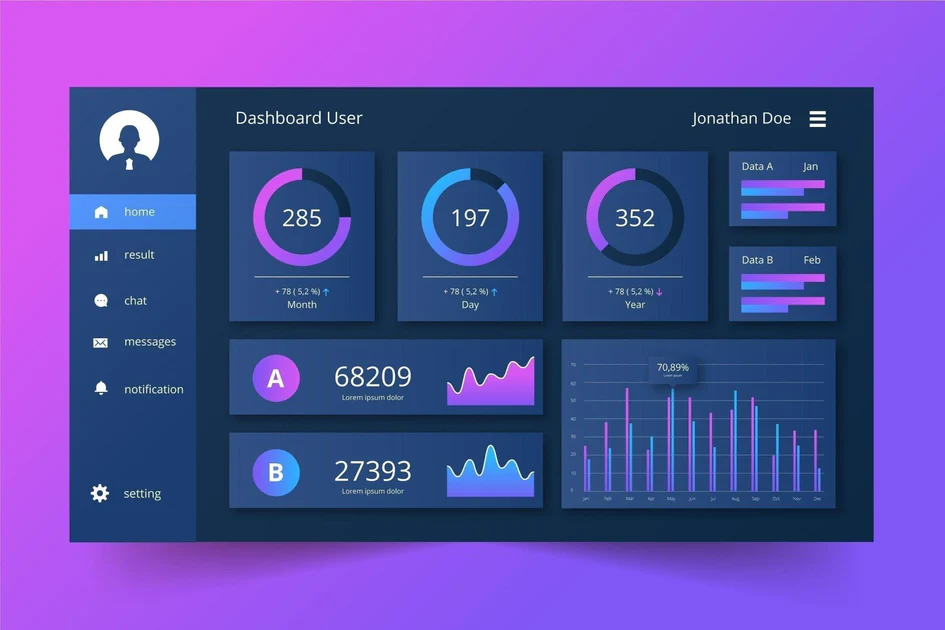
- Data centralized and integrated
- Automatic updates, no manual rework
- Real-time dashboards ready to use
- Reliable and standardized KPIs
- Meetings focused on decisions
Main offer
Find out in 3 minutes how much time your company loses because of decentralized data
Receive a free analysis with practical recommendations to reduce rework, increase confidence in your numbers and speed up decision-making.
Free · No commitment · Executive PDF included in the calculator
Your team should be analyzing data, not preparing data
30 minutes later, you will leave knowing:
- 01
Where your company is losing time on data
We identify the manual processes that consume the most of your team's hours and can be automated.
- 02
Why the numbers don't match across teams
We map the sources of inconsistency and show how to centralize data into a single reliable version.
- 03
Which indicators actually matter for your operation
We prioritize the 3 to 5 KPIs with the highest impact on your decisions, and stop measuring what doesn't move the needle.
- 04
Whether your data is ready for a dashboard or needs to be structured first
We map what exists, where it lives and what needs to be adjusted before building anything.
- 05
What the concrete next step would be and how long it would take
If there is a fit, you receive three delivery options with defined timelines and pricing. You choose the path.
Before and after
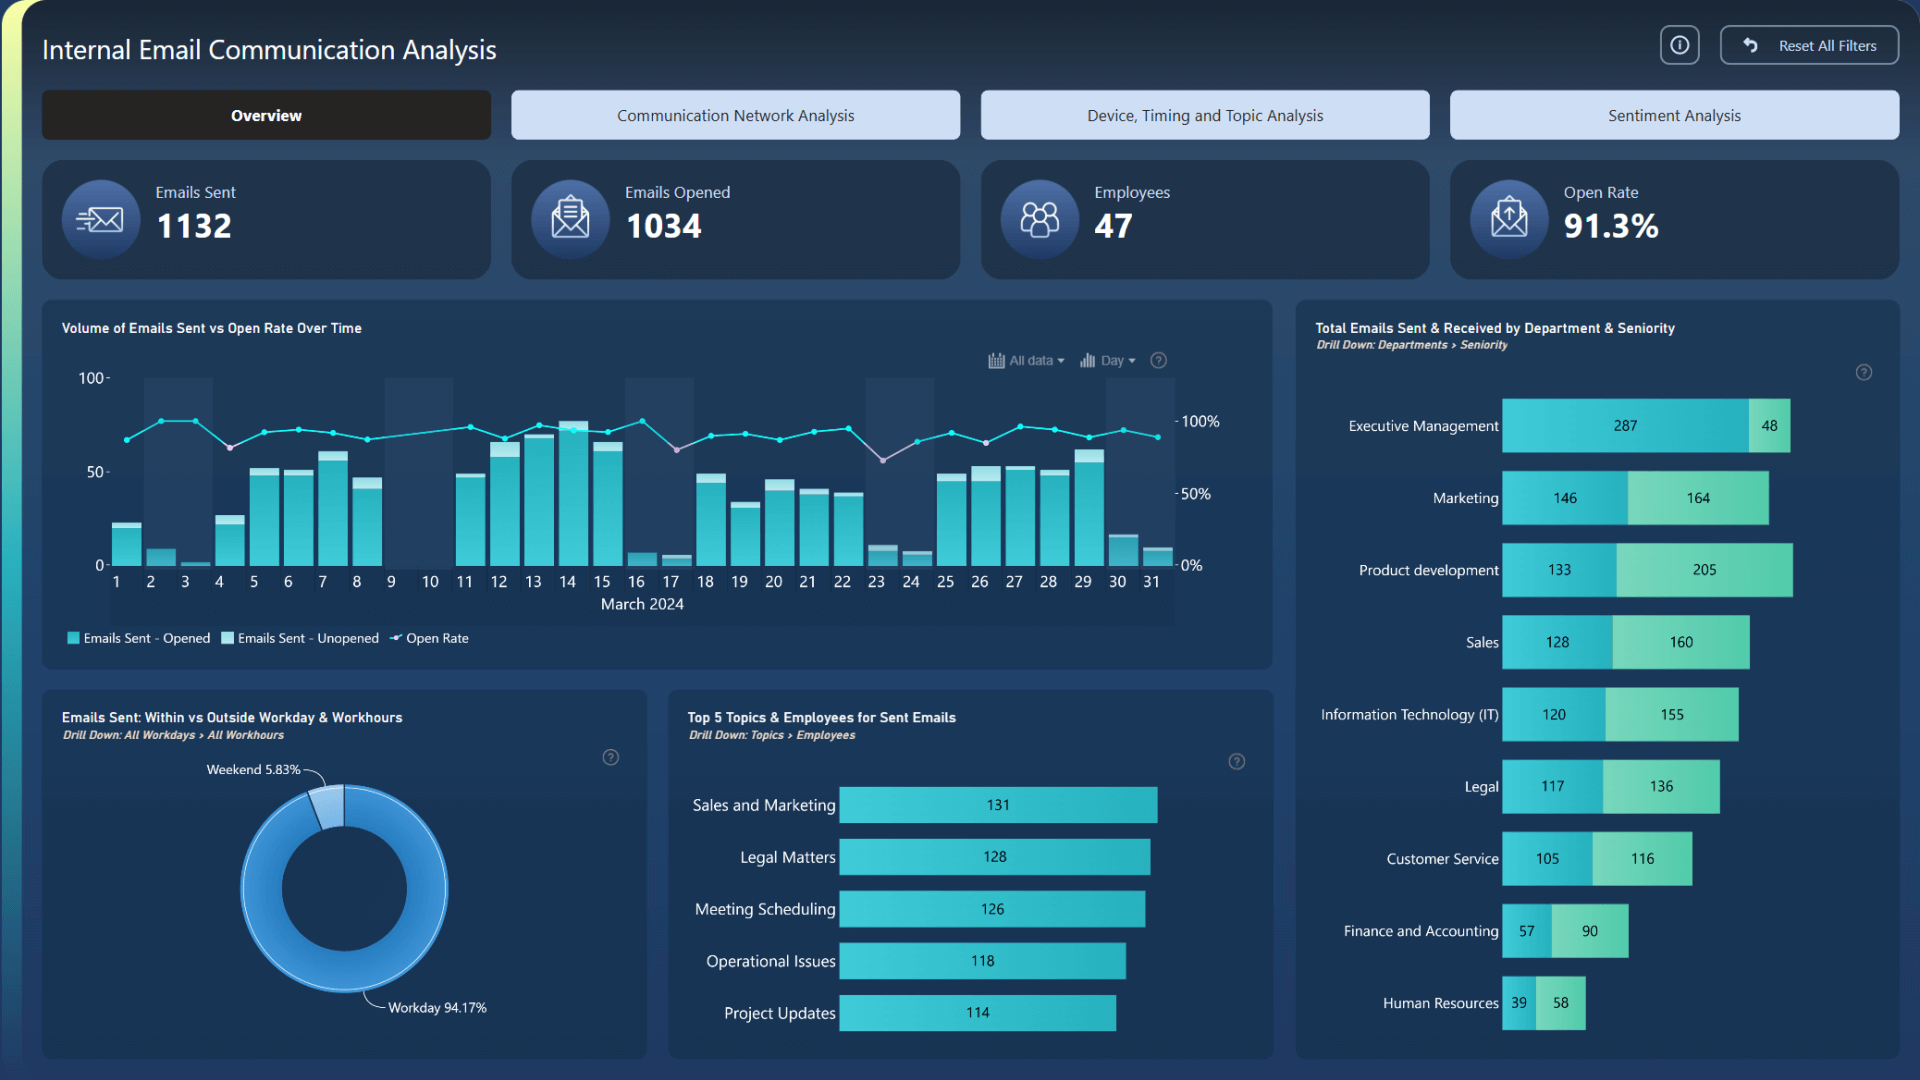
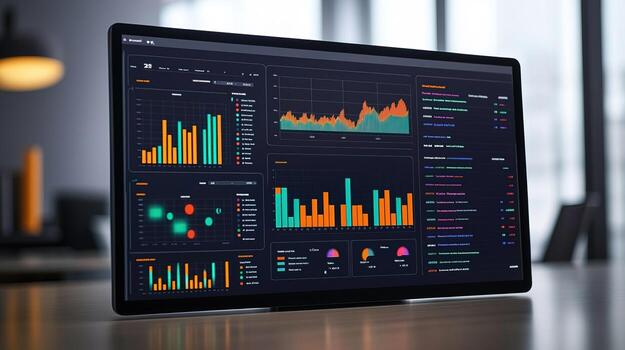
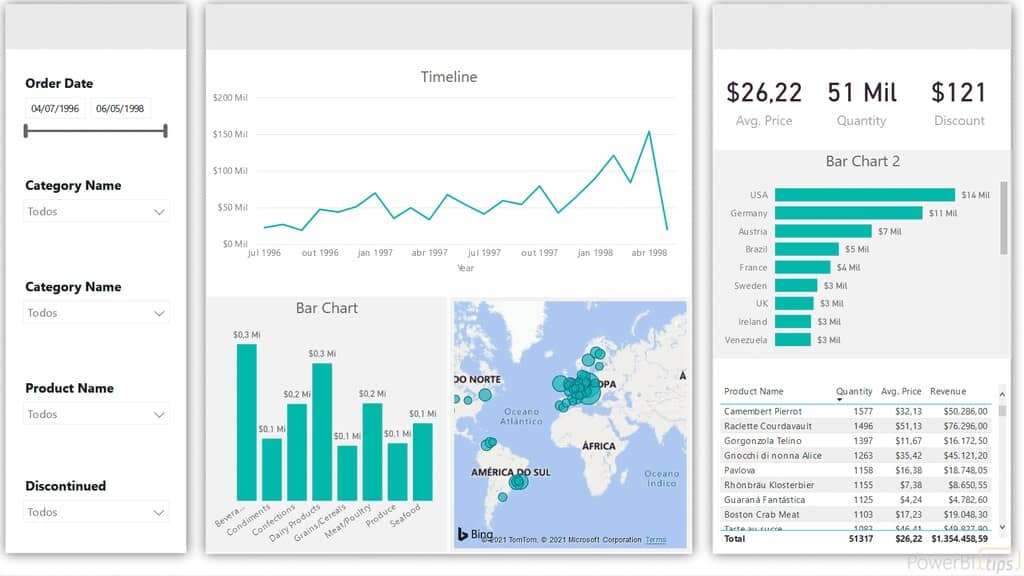
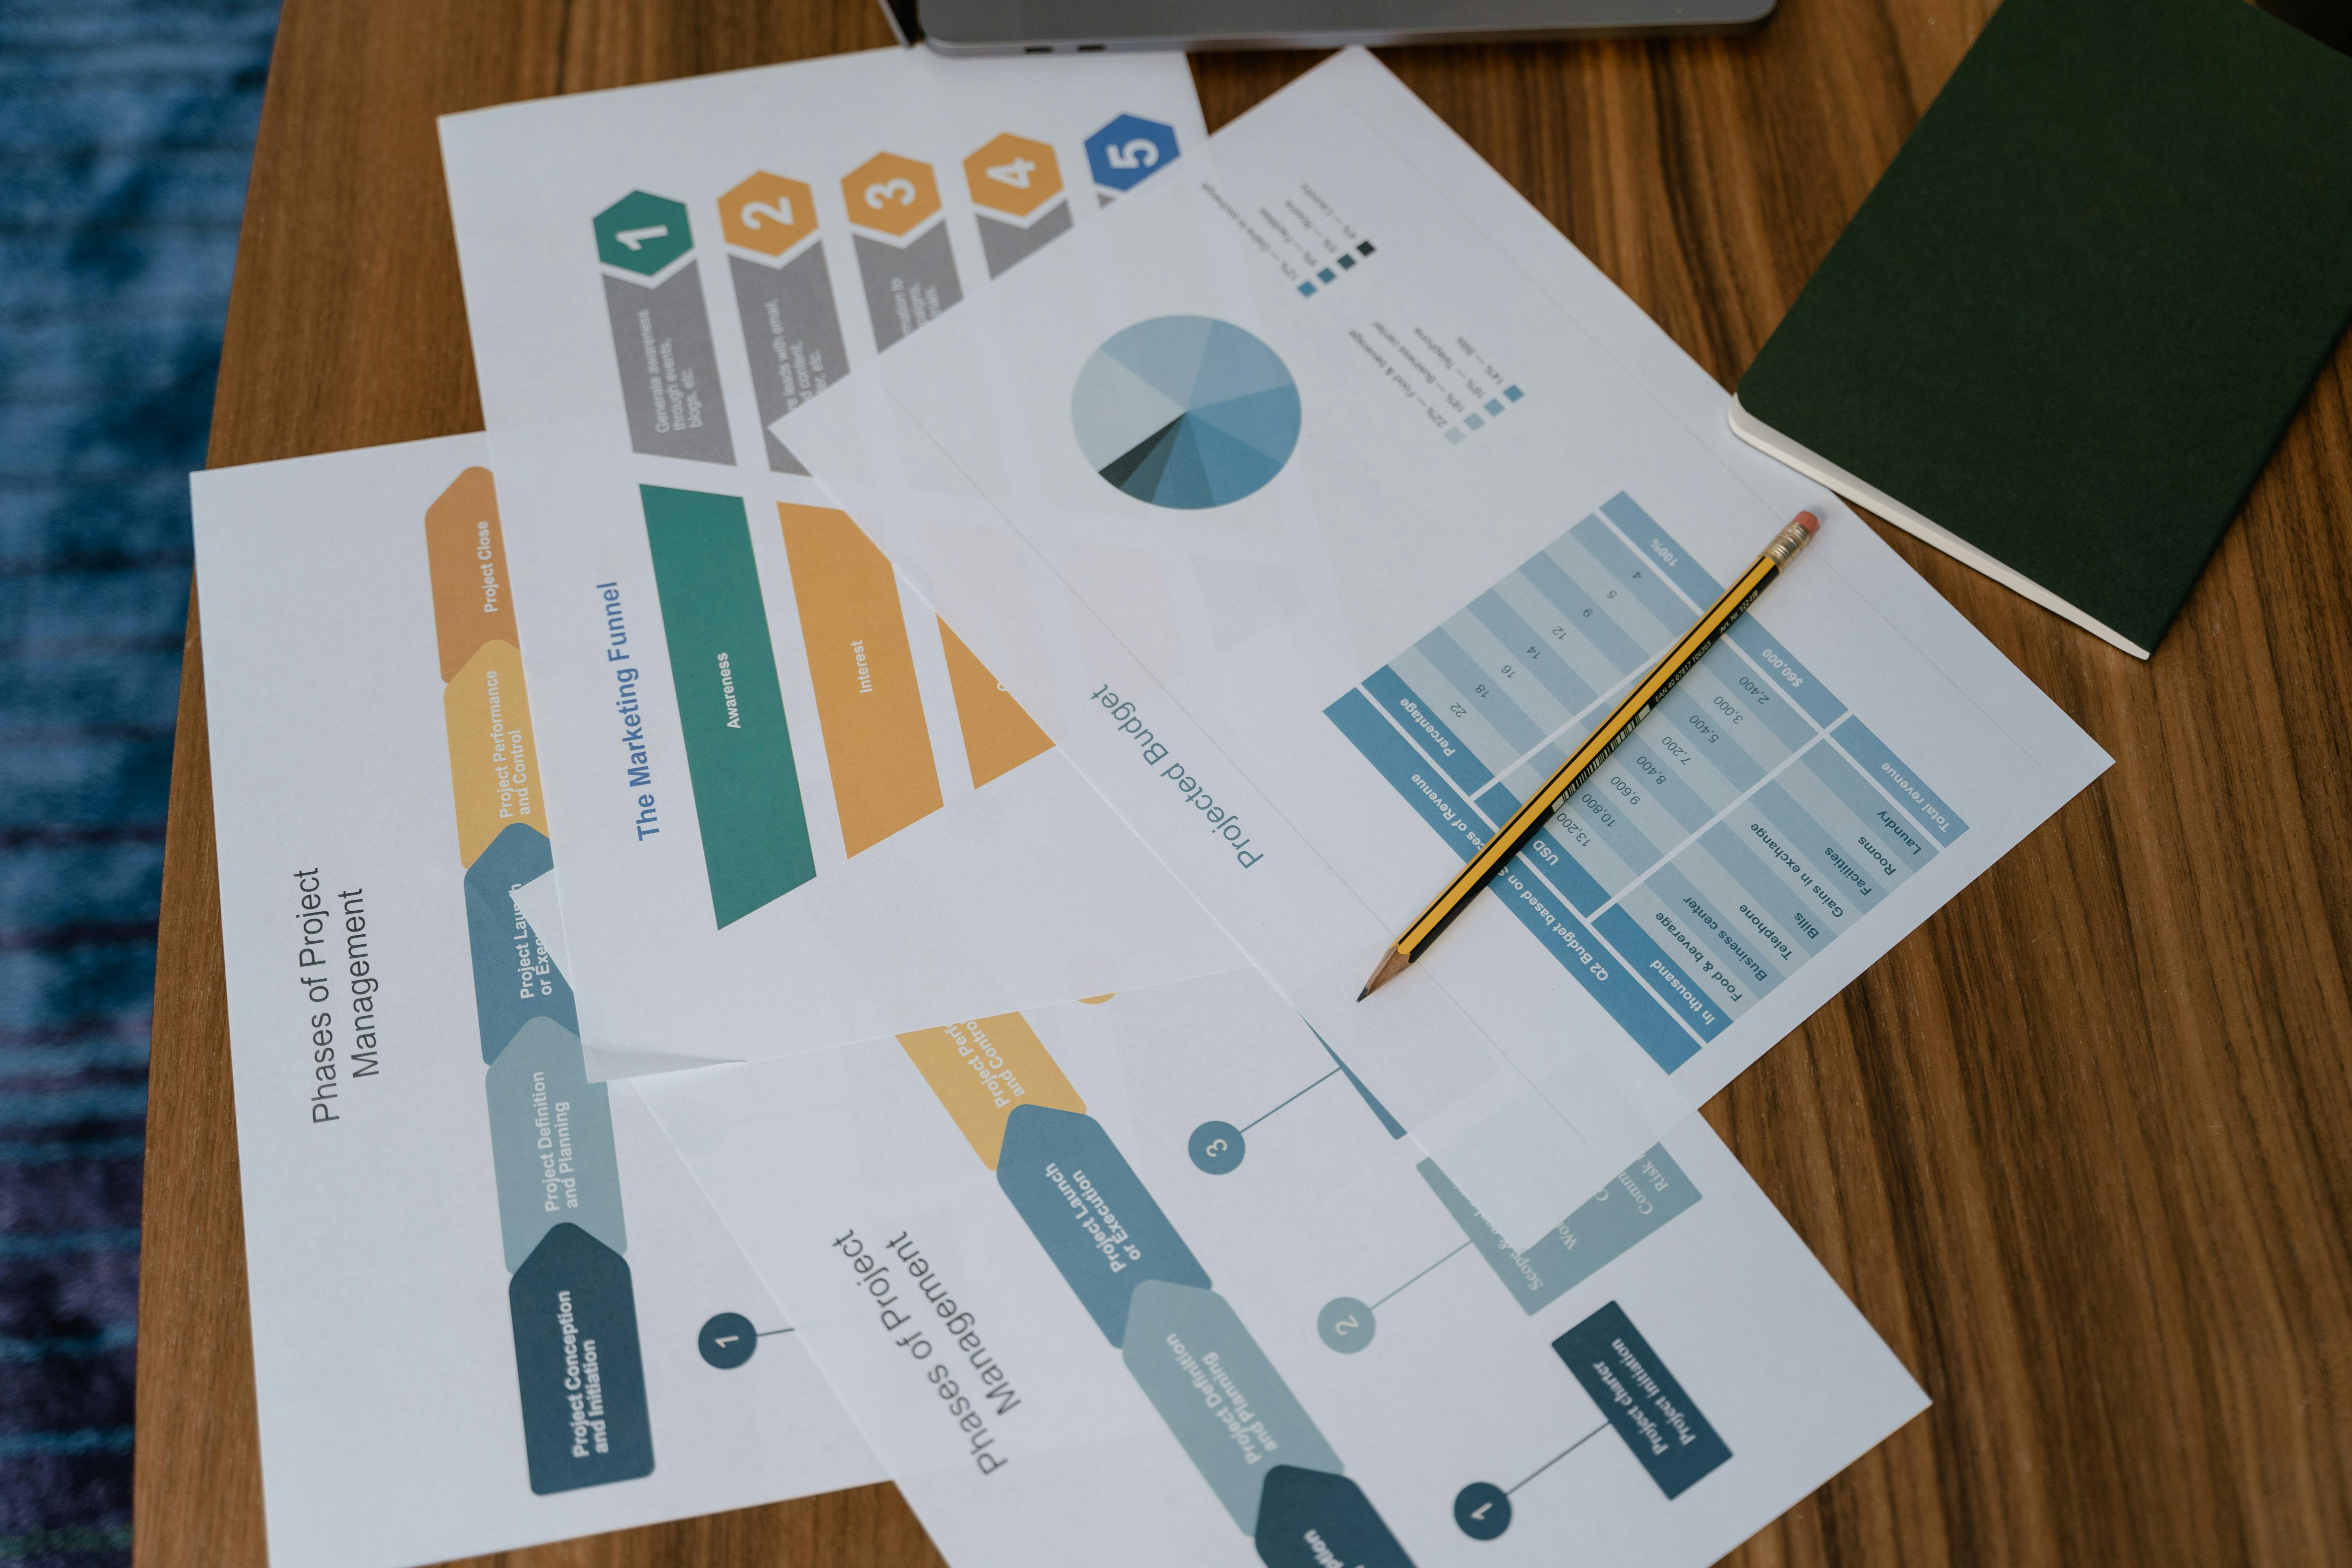
From a spreadsheet marathon to a single screen
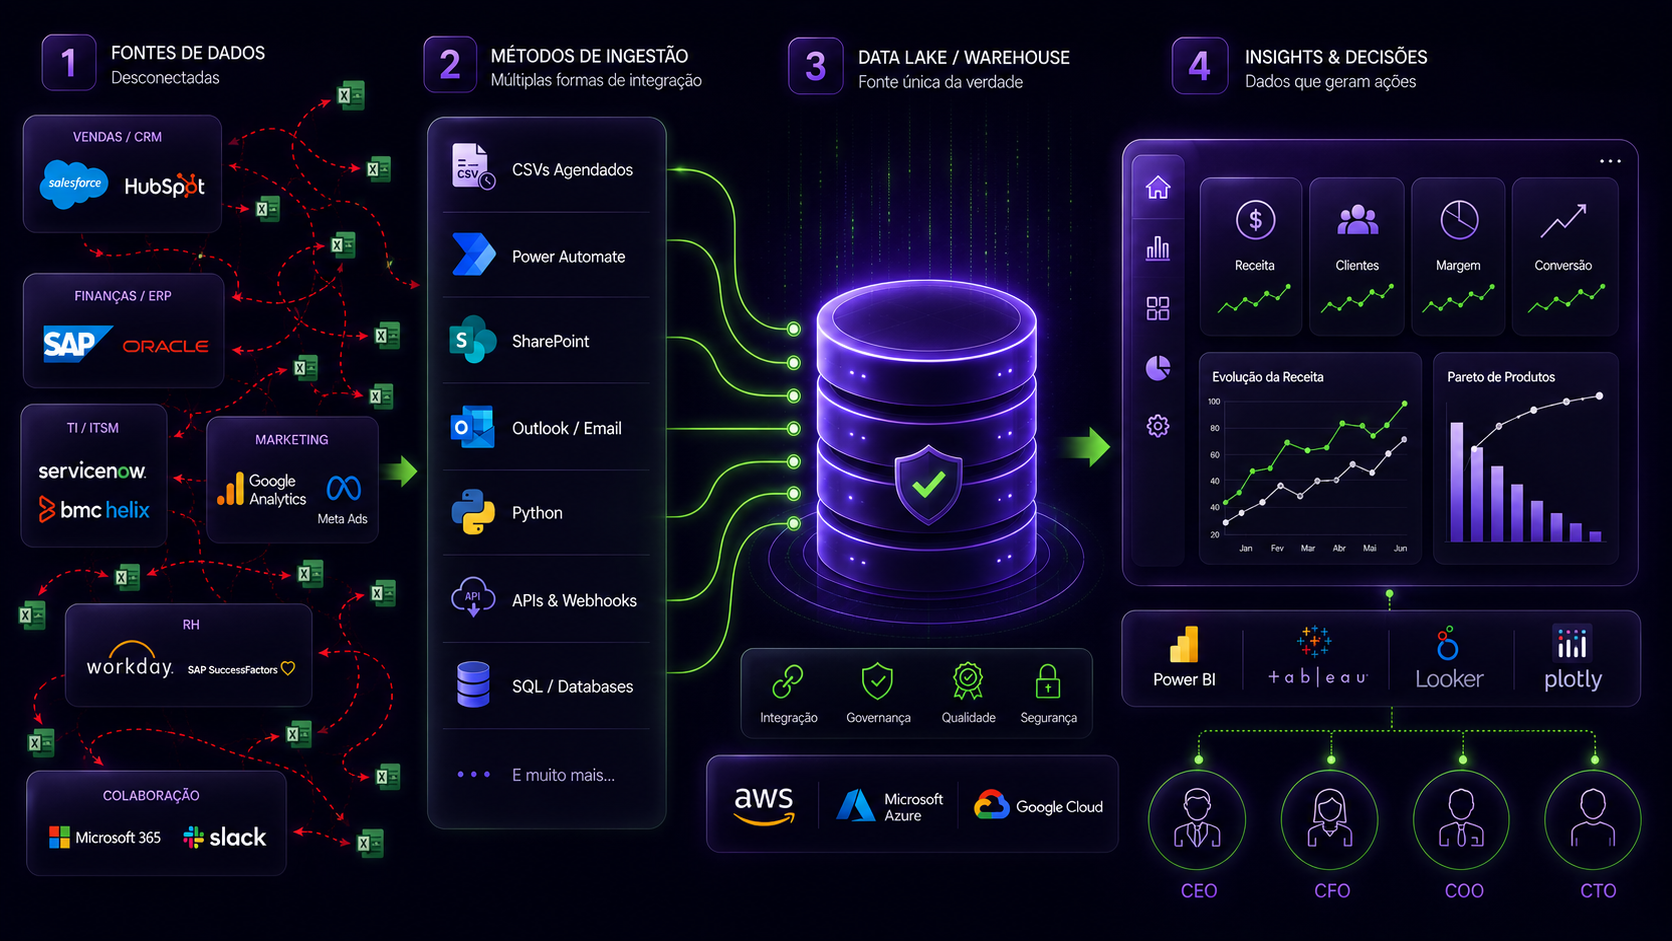
HOW IT WORKS IN PRACTICE
How it works
From assessment to dashboard in 5 steps
Free assessment
In 30 minutes, we map your data sources, identify bottlenecks and understand what is blocking faster decision-making.

Data integration
We connect spreadsheets, ERPs, CRMs and APIs into a single reliable model, eliminating inconsistencies across teams.

Automation
We replace repetitive manual processes with automatic update flows. Your team stops copy-pasting.
Dashboards
We build panels with the indicators that actually matter for your management, updated in real time.

Ongoing support
Continuous support for adjustments, team training and indicator expansion as the operation grows.
The problem may be simpler than it looks
Maybe it is not a lack of dashboards. It is the lack of a single source of truth
If you said yes to any of these, the problem is probably not in the reports. It is in how the data is organized.
- The numbers don't match across teams
- Every department has its own spreadsheet
- Reports always arrive too late
- You don't fully trust the indicators
- Your team loses hours consolidating data
- You don't know for certain which number is right
30 minutes · Free · Or calculate in 3 min without leaving the site
Research confirms the problem
It is not just your company
McKinsey Global Institute
“47% of global executives say data and analytics have significantly or fundamentally changed competition in their industries, while laggards face growing disadvantage.”
The Age of Analytics: Competing in a Data-Driven World · McKinsey Global InstituteDeloitte Insights
“Companies that become insight-driven speed up decision-making, reduce operational errors and build a sustainable competitive advantage over peers that still depend on manual data preparation.”
Insight-Driven Organisations · Deloitte InsightsPwC
“ERP data modernization unlocks value trapped in fragmented systems, turning disconnected data into a strategic asset for forecasting, reporting and confident decision-making.”
ERP Data Modernization · PwC“The problem is almost never a lack of data. It is the opportunity cost of not seeing, at the right moment, where profitability is slipping because information still depends on an intermediary to reach whoever decides.”
Loyal Consulting · Business IntelligenceFrequently asked questions
Questions before getting started
We tried BI before and no one used it. Why would this be different?
That is the most common story. BI projects fail almost always for the same reason: they started with the tool, not the problem. The assessment starts by identifying what data actually matters for each decision, and only then defines the right tool. The dashboard becomes a consequence, not a goal.
Our data lives in too many places. Seems too complex.
Most of the companies we work with are in exactly that situation: three systems, two spreadsheets and a report that doesn't agree with either of them. That is not an exception; it is the most common starting point. The assessment exists to map what is there and find the most direct path forward, without overpromising.
I'm worried the dashboard will be built but no one will use it.
That fear is among the most justified, and it almost always comes true when the dashboard was built without involving the people who will use it. Our process maps from the start who needs to see what, at what frequency and on which device. Adoption doesn't start at training; it starts at design.
I don't know exactly what I want. Is it still worth talking?
That is exactly what the assessment is for. Knowing that "the numbers arrive too late" or that "nobody agrees on which spreadsheet is right" is already enough to start. Scope clarity is the output of the assessment, not a prerequisite for it.
Does the assessment cost anything?
No. It is a 30-minute conversation. No product pitch, no commitment. If moving forward doesn't make sense at the end, you leave with more clarity about the problem than you came in with. That already has value on its own.
How long until I have something working?
Most companies want a dashboard "within a week." Sometimes that is possible (when the data is already organized). What determines the timeline is the quality of what exists, not the speed of development. The assessment maps that and returns a realistic estimate, without creating expectations that won't be met.
We already have a BI tool that isn't working well. Now what?
The tool is rarely the problem. The most common patterns are: poorly structured data feeding a well-built dashboard, or a technically correct panel that nobody knows how to use. The assessment looks at the full picture and only recommends changing tools when there is a concrete reason to do so.
About Loyal
Specialists in turning data into decisions
Boutique Business Intelligence consultancy
Loyal Consulting helps companies eliminate manual controls, integrate information and build reliable indicators for management.
Our focus is not just building dashboards. It is building the structure that makes the numbers meaningful and gets them there in time to influence the right decisions.
Find out how much time your team can save.
Get a free assessment of your data processes and identify opportunities for automation and integration, no cost, no commitment.